背景介绍问题排查查看 ck 节点存储占用情况查看 ttl 失效表的 TTL_DELETE 任务是否被推迟clickhouse ttl 原理手动删除分区适当增大 background_pool_size开启 ttl_only_drop_parts
背景介绍
目前线上环境 clickhouse 版本为 22.2.2.1
此版本发布时间为 2022-09-02 算是比较老的版本了,不过线上一直运行较为稳定
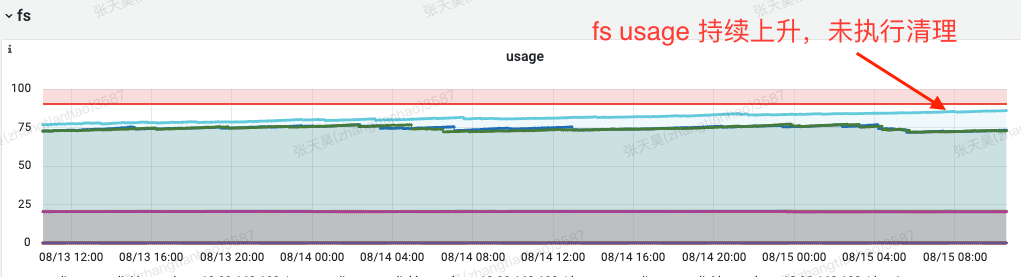
近期开始出现 ttl 失效问题,表现为磁盘占用提升,apm 表未按照预期 ttl 进行数据清理
目前线上 ck 共由三副本组成:
| replica_name | cpu/mem | 存储设备 | 磁盘使用率 |
|---|---|---|---|
| apm-ck-1 | 32c128g | 5.4T/7.8T ssd | 73% |
| apm-ck-2 | 32c128g | 5.4T/7.8T ssd | 73% |
| apm-ck-3 | 32c128g | 6.4T/7.8T ssd | 87% |
其中 apm-ck-3 节点磁盘占用由于 ttl 失效提升至 87%
目前所有表 ttl 均为 14 天,理论上 ck 会周期性的清除 14 天前的分区数据,但由于某种原因,apm-ck-3 节点 ttl 失效,导致仍旧存在 14 天前的分区数据
以最大的 dubbo 请求指标表为例:
表结构:
251CREATE TABLE apm.middleware_dubbo_service_request_total_ck_shard2(3 `_time` Int64 COMMENT 'null',4 `_app` LowCardinality(String) COMMENT 'null',5 `_ip` LowCardinality(String) COMMENT 'null',6 `_region` LowCardinality(String) COMMENT 'null',7 `_value` Float64 COMMENT 'null',8 `operation_name` LowCardinality(String) COMMENT 'null',9 `operation_side` LowCardinality(String) COMMENT 'null',10 `remote_ip` LowCardinality(String) COMMENT 'null',11 `remote_app` LowCardinality(String) COMMENT 'null',12 `tag` LowCardinality(String),13 PROJECTION app_side_projection14 (15 SELECT *16 ORDER BY17 _app,18 operation_side19 )20)21ENGINE = ReplicatedMergeTree('/clickhouse/tables/{shard}/middleware_dubbo_service_request_total_ck_shard', '{replica}')22PARTITION BY toDate(_time / 1000)23ORDER BY (_time, _app, _ip, _region, operation_name, operation_side, remote_ip, remote_app)24TTL toDate(_time / 1000) + toIntervalDay(14)25SETTINGS index_granularity = 8192, use_minimalistic_part_header_in_zookeeper = 1可以看到 ttl 设置为 14 天
11TTL toDate(_time / 1000) + toIntervalDay(14)查看分区数据量
11SELECT partition, formatReadableSize(sum(bytes)) FROM system.parts WHERE table = 'middleware_dubbo_service_request_total_ck_shard' GROUP BY partition ORDER BY partition DESC;201┌─partition──┬─formatReadableSize(sum(bytes_on_disk))─┐2│ 2025-08-15 │ 65.37 GiB │3│ 2025-08-14 │ 139.03 GiB │4│ 2025-08-13 │ 142.71 GiB │5│ 2025-08-12 │ 144.89 GiB │6│ 2025-08-11 │ 144.05 GiB │7│ 2025-08-10 │ 146.18 GiB │8│ 2025-08-09 │ 145.40 GiB │9│ 2025-08-08 │ 143.78 GiB │10│ 2025-08-07 │ 142.67 GiB │11│ 2025-08-06 │ 140.19 GiB │12│ 2025-08-05 │ 138.82 GiB │13│ 2025-08-04 │ 139.36 GiB │14│ 2025-08-03 │ 140.11 GiB │15│ 2025-08-02 │ 138.26 GiB │16│ 2025-08-01 │ 134.47 GiB │17│ 2025-07-31 │ 95.73 GiB │18│ 2025-07-30 │ 137.00 GiB │19│ 2025-07-29 │ 143.92 GiB │20└────────────┴────────────────────────────────────────┘可以看到 14 天前从 2025-07-29 到 2025-08-01,共有 4 天的分区数据未被清除
并非只有 middleware_dubbo_service_request_total_ck_shard 表,从 2025-07-29 开始所有表 ttl 均失效
问题排查
查看 ck 节点存储占用情况
111-- 查看表占用情况2select table as `表名`, sum(rows) as `总行数`, formatReadableSize(sum(data_uncompressed_bytes)) as `原始大小`, formatReadableSize(sum(data_compressed_bytes)) as `压缩大小`, round((sum(data_compressed_bytes) / sum(data_uncompressed_bytes)) * 100, 0) as `压缩率` from system.parts group by table order by sum(data_compressed_bytes) desc limit 10;3
4-- 查看全体表占用情况5select sum(rows) as `总行数`, formatReadableSize(sum(data_uncompressed_bytes)) as `原始大小`, formatReadableSize(sum(data_compressed_bytes)) as `压缩大小`, round((sum(data_compressed_bytes) / sum(data_uncompressed_bytes)) * 100, 0) as `压缩率` from system.parts order by sum(data_compressed_bytes) desc;6
7-- 查看 projection 占用情况8select table as `表名`, sum(rows) as `总行数`, formatReadableSize(sum(data_uncompressed_bytes)) as `原始大小`, formatReadableSize(sum(data_compressed_bytes)) as `压缩大小`, round((sum(data_compressed_bytes) / sum(data_uncompressed_bytes)) * 100, 0) as `压缩率` from system.projection_parts group by table order by sum(data_compressed_bytes) desc limit 10;9
10-- 查看所有 projection 占用情况11select sum(rows) as `总行数`, formatReadableSize(sum(data_uncompressed_bytes)) as `原始大小`, formatReadableSize(sum(data_compressed_bytes)) as `压缩大小`, round((sum(data_compressed_bytes) / sum(data_uncompressed_bytes)) * 100, 0) as `压缩率` from system.projection_parts order by sum(data_compressed_bytes) desc;
查看 ttl 失效表的 TTL_DELETE 任务是否被推迟
51# 查询所有表任务队列数2SELECT table, count(*) as total FROM system.replication_queue group by table order by total desc3
4# 查询指定表 TTL 任务5SELECT * FROM system.replication_queue WHERE database = 'apm' AND table = 'middleware_dubbo_service_request_total_ck_shard' AND merge_type = 'TTL_DELETE' ORDER BY create_time DESC FORMAT Vertical;221Row 1:2──────3database: apm4table: middleware_dubbo_service_request_total_ck_shard5replica_name: ch-036position: 07node_name: queue-18606781158type: MERGE_PARTS9create_time: 2025-08-23 00:00:0010required_quorum: 011source_replica: ch-0312new_part_name: 20250809_0_1781810_6513parts_to_merge: ['20250809_0_1313990_14','20250809_1313991_1345492_11','20250809_1345493_1398516_11','20250809_1398517_1513749_11','20250809_1513750_1578074_10','20250809_1578075_1601988_10','20250809_1601989_1612250_9','20250809_1612251_1642374_27','20250809_1642375_1733670_64','20250809_1733671_1766274_58','20250809_1766275_1781565_52','20250809_1781566_1781809_49','20250809_1781810_1781810_0']14is_detach: 015is_currently_executing: 016num_tries: 017last_exception:18last_attempt_time: 1970-01-01 08:00:0019num_postponed: 3498320postpone_reason: Not executing log entry queue-1860678115 for part 20250809_0_1781810_65 because 2 merges with TTL already executing, maximum 2.21last_postpone_time: 2025-08-25 11:02:0922merge_type: TTL_DELETE可以看到任务被推迟 34983 次,推迟原因是:Not executing log entry queue-1860678115 for part 20250809_0_1781810_65 because 2 merges with TTL already executing, maximum 2.
受限于 TTL 合并任务的最大执行次数 2,这导致本任务一直被推迟
在ClickHouse的配置文件(如 config.xml)或用户配置文件中,增加以下参数的值:
31<merge_tree>2 <max_replicated_merges_with_ttl_in_queue>100</max_replicated_merges_with_ttl_in_queue>3</merge_tree>
可以提升 ttl 合并任务的并发数
尝试从 2 提升到 100,重启 clickhouse-server
此时再查询任务列表发现:
xxxxxxxxxx681Row 1:2──────3database:               apm4table:                  middleware_dubbo_service_request_total_ck_shard5replica_name:           ch-036position:               17node_name:              queue-18660060838type:                   MERGE_PARTS9create_time:            2025-08-25 11:25:4110required_quorum:        011source_replica:         ch-0312new_part_name:          20250811_0_1816898_6713parts_to_merge:         ['20250811_0_1410596_13','20250811_1410597_1770904_27','20250811_1770905_1816780_66','20250811_1816781_1816894_27','20250811_1816895_1816898_1']14is_detach:              015is_currently_executing: 016num_tries:              017last_exception:18last_attempt_time:      1970-01-01 08:00:0019num_postponed:          8426820postpone_reason:        Not executing log entry queue-1866006083 of type MERGE_PARTS for part 20250811_0_1816898_67 because source parts size (144.44 GiB) is greater than the current maximum (391.92 MiB).21last_postpone_time:     2025-08-25 11:44:1822merge_type:             TTL_DELETE23
24Row 2:25──────26database:               apm27table:                  middleware_dubbo_service_request_total_ck_shard28replica_name:           ch-0329position:               030node_name:              queue-186600608231type:                   MERGE_PARTS32create_time:            2025-08-25 11:25:4033required_quorum:        034source_replica:         ch-0335new_part_name:          20250810_0_1888204_6036parts_to_merge:         ['20250810_0_752868_13','20250810_752869_1178929_12','20250810_1178930_1322126_11','20250810_1322127_1464019_11','20250810_1464020_1657375_27','20250810_1657376_1885016_59','20250810_1885017_1888203_48','20250810_1888204_1888204_0']37is_detach:              038is_currently_executing: 039num_tries:              040last_exception:41last_attempt_time:      1970-01-01 08:00:0042num_postponed:          8426843postpone_reason:        Not executing log entry queue-1866006082 of type MERGE_PARTS for part 20250810_0_1888204_60 because source parts size (146.37 GiB) is greater than the current maximum (391.92 MiB).44last_postpone_time:     2025-08-25 11:44:1845merge_type:             TTL_DELETE46
47Row 3:48──────49database:               apm50table:                  middleware_dubbo_service_request_total_ck_shard51replica_name:           ch-0352position:               253node_name:              queue-186067811554type:                   MERGE_PARTS55create_time:            2025-08-23 00:00:0056required_quorum:        057source_replica:         ch-0358new_part_name:          20250809_0_1781810_6559parts_to_merge:         ['20250809_0_1313990_14','20250809_1313991_1345492_11','20250809_1345493_1398516_11','20250809_1398517_1513749_11','20250809_1513750_1578074_10','20250809_1578075_1601988_10','20250809_1601989_1612250_9','20250809_1612251_1642374_27','20250809_1642375_1733670_64','20250809_1733671_1766274_58','20250809_1766275_1781565_52','20250809_1781566_1781809_49','20250809_1781810_1781810_0']60is_detach:              061is_currently_executing: 162num_tries:              163last_exception:64last_attempt_time:      2025-08-25 11:27:1365num_postponed:          98266postpone_reason:        Not executing log entry queue-1860678115 of type MERGE_PARTS for part 20250809_0_1781810_65 because source parts size (145.41 GiB) is greater than the current maximum (19.80 MiB).67last_postpone_time:     2025-08-25 11:27:1368merge_type:             TTL_DELETE
可以看到推迟原因变成了:Not executing log entry queue-1860678115 of type MERGE_PARTS for part 20250809_0_1781810_65 because source parts size (145.41 GiB) is greater than the current maximum (19.80 MiB).
这里也有一个配置项 max_bytes_to_merge_at_max_space_in_pool,在最新版的配置中它被默认为 150GB
根据我们的存储现状,将其修改为 200GB 也就是 214748364800,再次重启 clickhouse
clickhouse ttl 原理
了解 clickhouse merge
了解 ttl 为什么发生在 merge 期间
手动删除分区
xxxxxxxxxx11alter table apm.middleware_dubbo_service_request_total_ck_shard drop partition '2025-07-29';
注:
当删除任务卡住,可以查询系统表 system.replication_queue,确认是否有卡住的任务:
xxxxxxxxxx11SELECT * FROM system.replication_queue WHERE database = 'apm' AND table = 'middleware_dubbo_service_request_total_ck_shard' AND (type = 'DROP_RANGE' OR type = 'REPLACE_RANGE') ORDER BY create_time DESC FORMAT Vertical;如果任务长时间卡住(如 num_tries 过高或 last_exception 报错),执行下面的 sql 重启表的副本(强制重置队列状态)
xxxxxxxxxx11SYSTEM RESTART REPLICA apm.middleware_dubbo_service_request_total_ck_shard再手动删除 detached 目录,一般为:
xxxxxxxxxx11/{path-to-clickhouse}/clickhouse/data/store/{uk1}/{uk-full}/detached
适当增大 background_pool_size
提升后台线程 cpu 利用率,酌情提高,可能影响查询
xxxxxxxxxx11vim /etc/clickhouse-server/users.xmlxxxxxxxxxx71<clickhouse>2 <profiles>3 <default>4 <background_pool_size>32</background_pool_size>5 </default>6 </profiles>7</clickhouse>开启 ttl_only_drop_parts
提升 ttl 删除失效数据的速度
xxxxxxxxxx11vim /etc/clickhouse-server/config.xmlxxxxxxxxxx51<clickhouse>2 <merge_tree>3 <ttl_only_drop_parts>1</ttl_only_drop_parts>4 </merge_tree>5</clickhouse>